In February of 2026, the American Public Transportation Association (APTA) released their new report “Economic Impact of Public Transportation Investment.” In it, APTA evaluates how their recommended investment in public transportation delivers economic value over the next twenty years (ending in 2045).
Main Takeaway
As written in the Executive Summary on page 2, “Increased public transportation investment can lead to significant economic growth, as a consequence of both the short-term stimulus impact of public transportation outlays and a longer-term, cumulative impact on economic productivity.”
Key Findings
“A program of enhanced transit investment sustained over 20 years can have a total effect on the economy and society of approximately 5 times the amount being spent annually.” This is equivalent to the value of:
- $5 billion of additional GDP
- 41400 Jobs
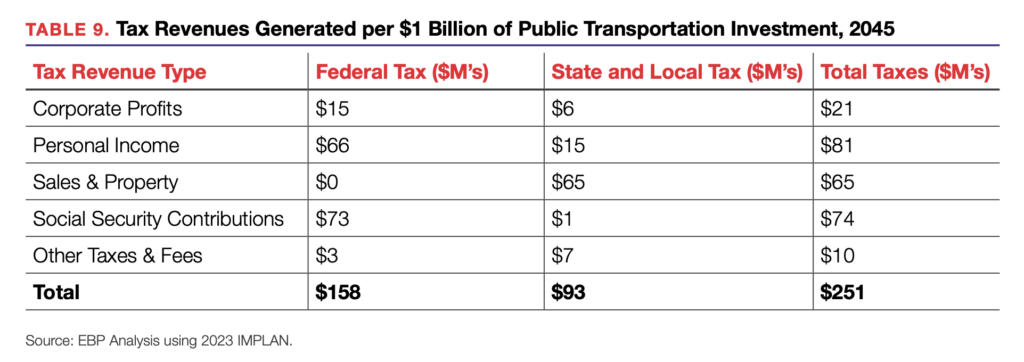
- $251 million in tax revenue
- $550 million in safety benefits
- $3.1 billion in wages
As the report states “If Congress invests in public transportation at the level included in the American Public Transportation Association (APTA) 2026 Surface Transportation Authorization Recommendations, it will result in an additional $139.6 billion in annual impacts on the economy, compared to baseline investment levels.”
Transportation Performance Impacts on the Economy
The report found that when investments are made in public transportation, the numerous positives that public transportation allows for in turn creates an improved economy.
The report focused on five different investment impacts on the economy:
- Traveler Benefits include marginal (Per Trip) cost savings, time savings from congestion reduction, cost savings from reduction in vehicle ownership, and transit user time savings.
- “$1 billion in transit investment generates $1.1 billion in auto ownership savings”
- “$30.9 billion saved in car operating costs annually in 2045” through decreases in individual car ownership
- Increase in Enabled Transit Trips (including commute, medical, shopping, and recreational trips) will lead to “actual dollars earned by workers having a direct impact on the economy.”
- Broader community impacts
- $550 million in safety benefits (split between injury reduction and reduced costs for emergency services and traffic enforcement)
- $787 million in environmental impacts (based on a “willingness to pay” framework)
- $2.4 billion in avoided costs associated with roadway construction
- Increase in economic accessibility is estimated to be $316 million, stemming from an increased number of people who are able to work at and frequent businesses and the business productivity benefits that come from the clustering of complementary businesses.
- State of good repair impacts (stemming from “lower average vehicle age” through investment) saves $21.6 million decreasing “user delays from vehicle failures” and lower “maintenance and fuel costs” leading to $807.2 million saved by 2045
Transportation Spending Impacts on the Economy
The report found that when there are increased levels of spending on public transportation there are both improvements in the economy and increases in job generation.
Indirect and induced spending effects – “Direct investment in public transportation projects, equipment, and services leads to broader effects on the economy.”
- Supplier Purchases: directly spending money on manufacturing and building supplies needed for the physical investments in transportation
- Employee Spending: the amount of “income spent on consumer goods and services, including healthcare, food, clothing, shelter, recreation, and personal services” by workers of public transportation.
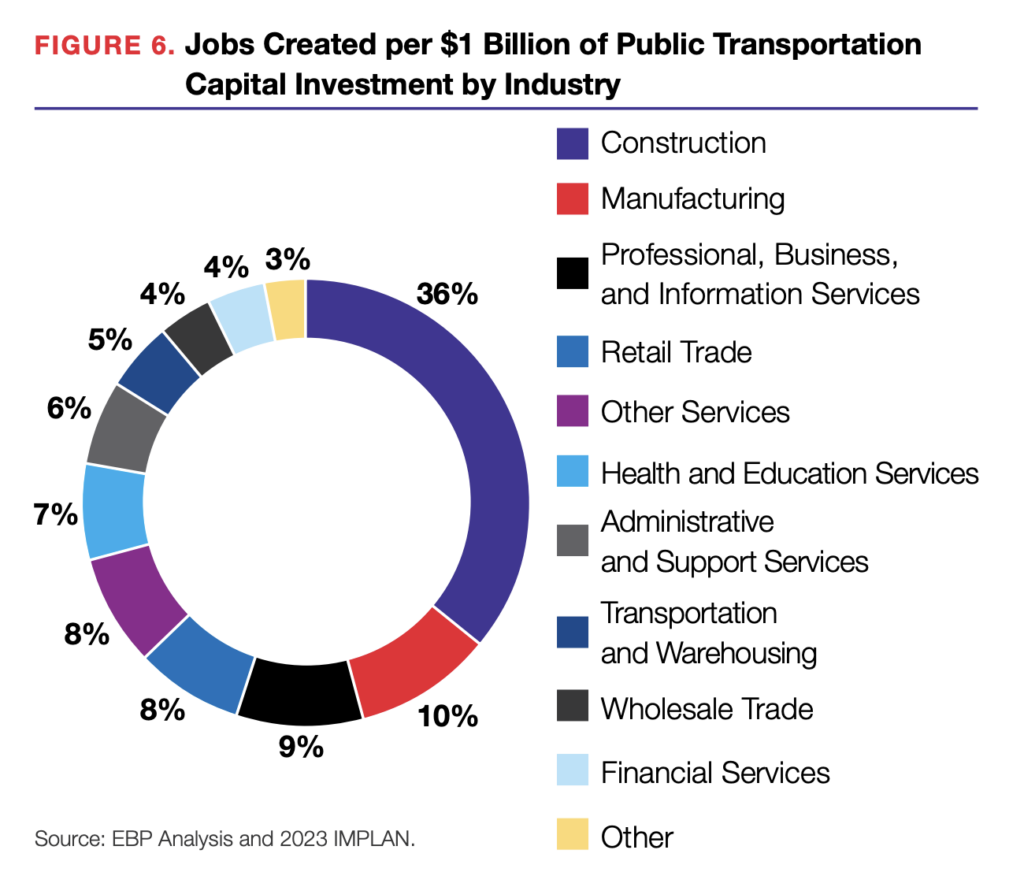
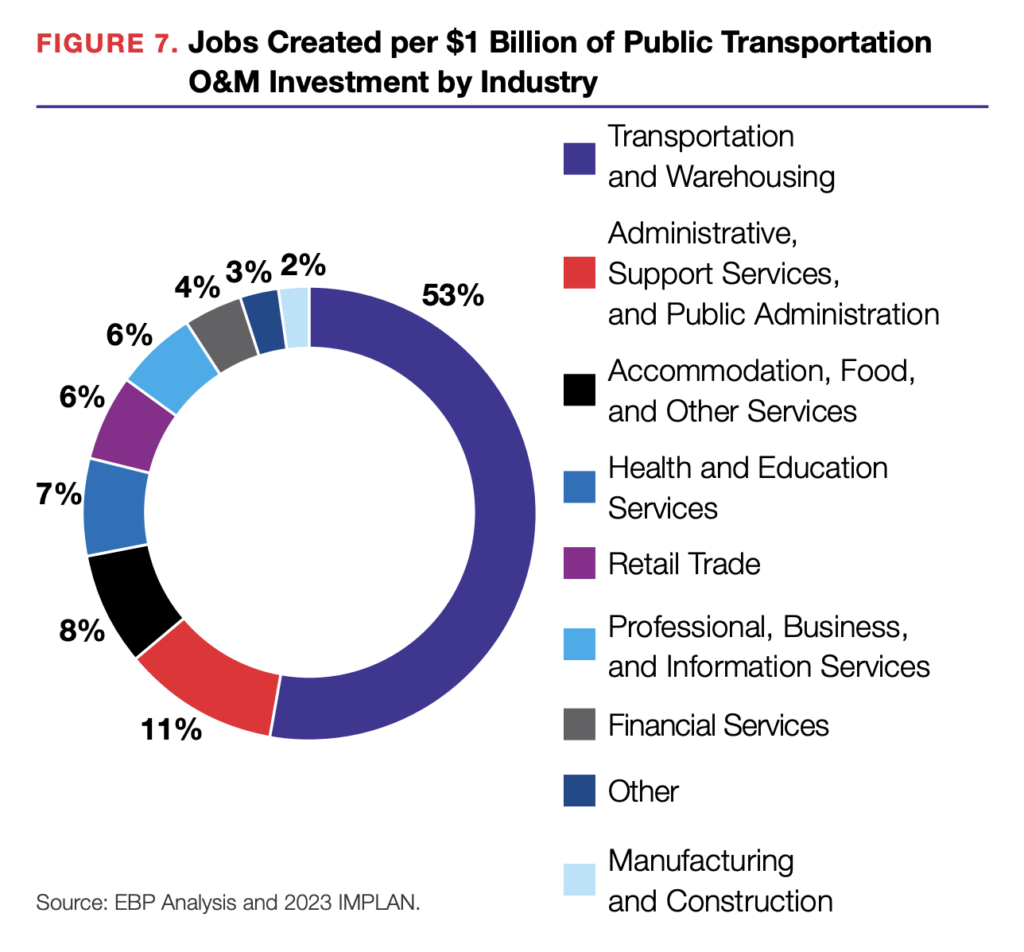
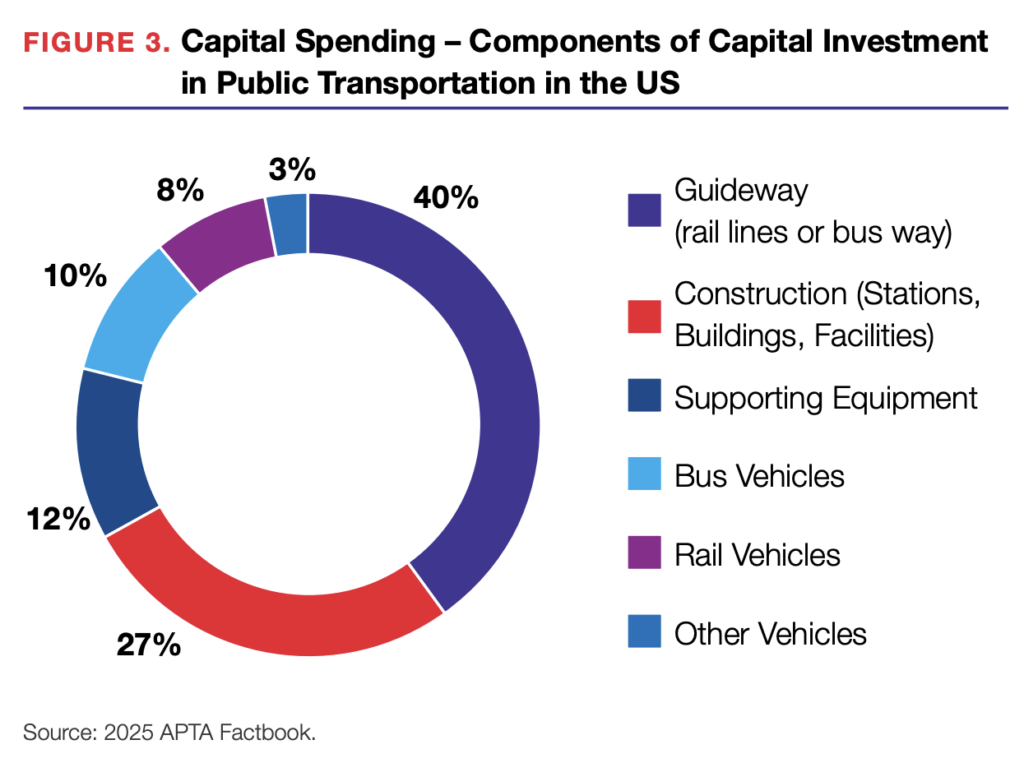
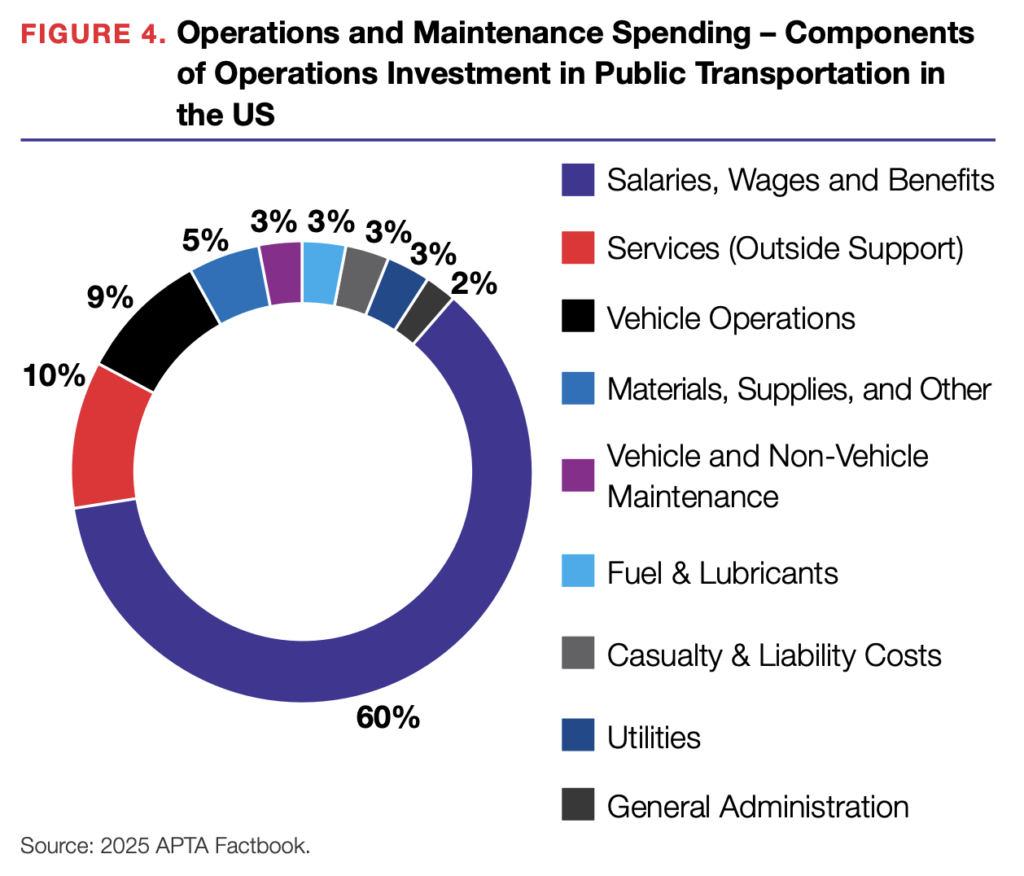
Investment in public transportation capital and operations lead to different forms of job and income generation and affect different industries in the economy.
- Capital spending for transit vehicle purchases decreased in 2023
- Capital spending for construction of guideway as a share of total capital spending remained consistent with a previous report published in 2017
- Spending on construction of buildings and related facilities increased in 2023
Metrics of Economic Impact
The economic impact of investment in public transportation occurs in the form of an increase in economic “activity” which can be measured in four ways. They are:
- Total business output (volume of business revenues or sales)
- Total Gross Domestic Product (GDP) (also referred to as “value added”, which reflects business profit, personal income, and taxes)
- Total labor income (i.e., wages/payroll & benefits, which is a subset of GDP)
- Total jobs associated with that labor income
Job Generation Impacts by Industry